

D-2 international students reach 236,366, up 23.6% in one year
An analysis of Ministry of Justice source data for June 2026 shows growth in D-2 study and D-4 general-training status holders and their distribution by nationality and region.
Key Points
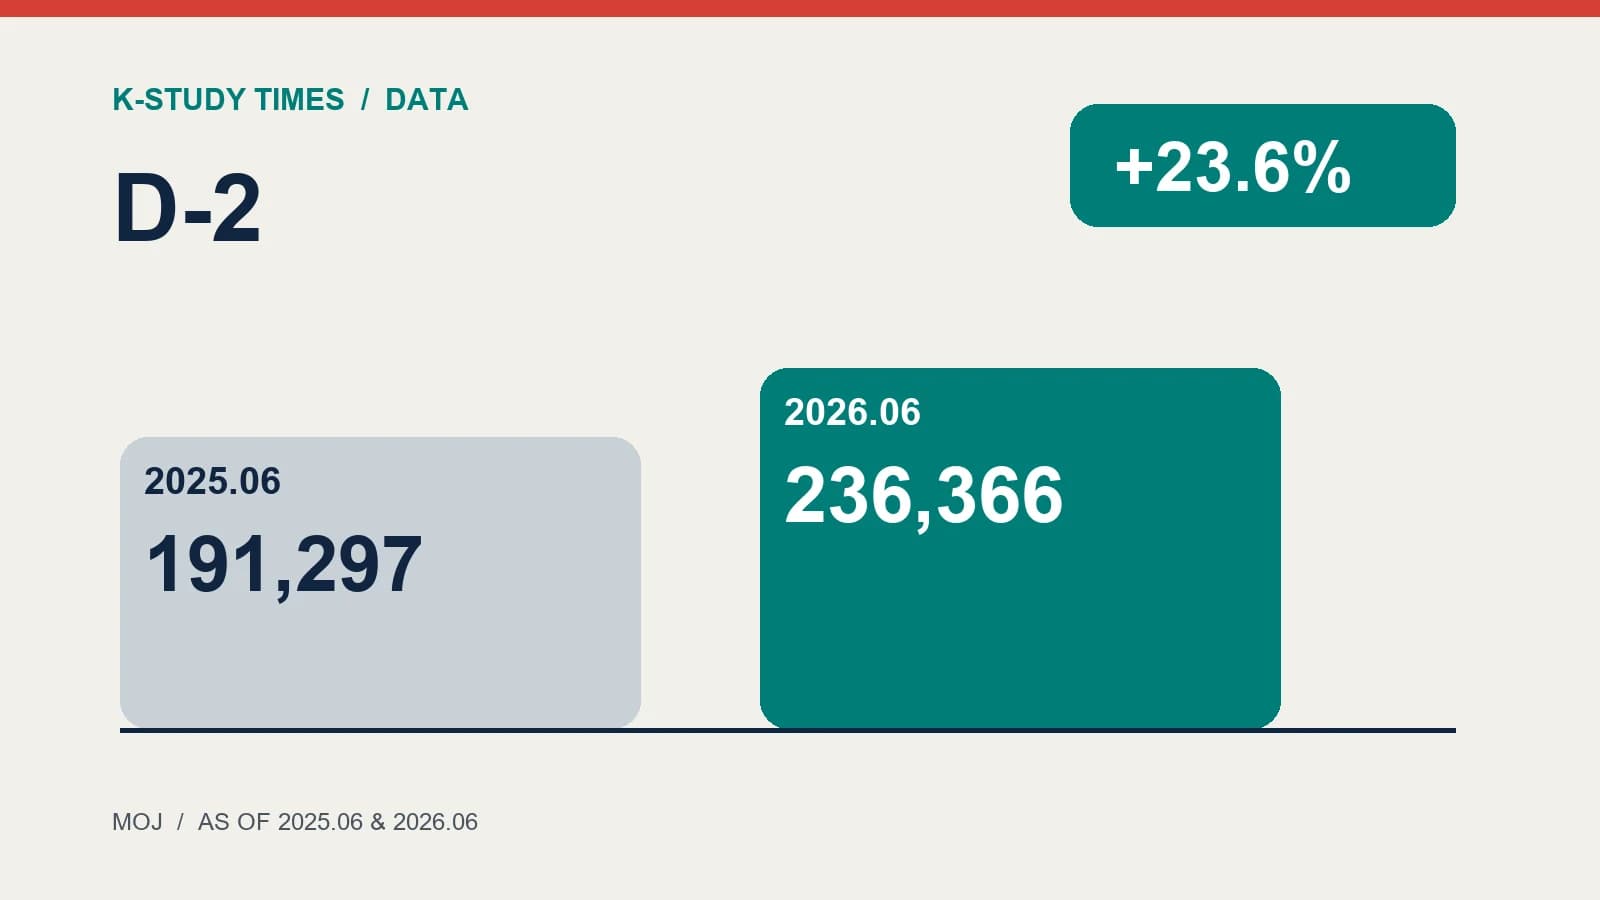
- The number of foreign nationals staying in Korea on D-2 (study) status reached 236,366 at the end of June 2026.
- That was an increase of 45,069, or 23.6%, from 191,297 a year earlier.
The number of foreign nationals staying in Korea on D-2 (study) status reached 236,366 at the end of June 2026. That was an increase of 45,069, or 23.6%, from 191,297 a year earlier. D-4 (general training) status holders rose 2.5% over the same period, from 88,472 to 90,691.
The figures come from a like-for-like comparison of the June 2025 and June 2026 source tables released by the Korea Immigration Service under the Ministry of Justice. Growth in study and training residents over the past year was driven mainly by D-2, which is used for degree programs, rather than D-4.
China remains No. 1 for D-2, while Vietnam closes the gap quickly
In June 2026, Chinese nationals were the largest D-2 group at 69,367, followed by Vietnamese nationals at 65,545. Together, the two countries accounted for 57.1% of all D-2 residents. The top five countries, including Uzbekistan, Nepal and Mongolia, totaled 188,875 people, or 79.9% of the total.
| Nationality | June 2025 | June 2026 | One-year change | Change rate |
|---|---|---|---|---|
| China | 66,571 | 69,367 | +2,796 | +4.2% |
| Vietnam | 47,628 | 65,545 | +17,917 | +37.6% |
| Uzbekistan | 14,833 | 20,277 | +5,444 | +36.7% |
| Nepal | 12,752 | 19,473 | +6,721 | +52.7% |
| Mongolia | 11,692 | 14,213 | +2,521 | +21.6% |
China still had the largest D-2 population, but Vietnam recorded the bigger numerical increase. The Vietnamese D-2 population grew by 17,917 in one year, narrowing the gap with China to 3,822. Nepal posted the highest growth rate among the top five countries.
Changes were also substantial outside the top group. The number of D-2 residents from Myanmar rose 68.0%, from 4,306 to 7,233, while the number from Bangladesh increased 86.0%, from 2,999 to 5,577. China and Vietnam's combined share fell 2.6 percentage points, from 59.7% in 2025 to 57.1% in 2026, as D-2 populations from Myanmar and Bangladesh also grew rapidly.
D-4 reaches 90,691, with Vietnam accounting for 65.8%
The total D-4 population increased by 2,219 in one year. Vietnamese nationals accounted for 59,650, or 65.8% of all D-4 residents, followed by Mongolia with 5,532, Myanmar with 5,038 and China with 4,511.
D-2 and D-4 cannot be read as if they describe the same group. D-2 is used for degree programs including associate, bachelor's, master's and doctoral courses, while D-4 covers general training, including language study at university-affiliated institutes. Because the D-4 column in the Ministry of Justice source data combines several subcategories, describing all 90,691 people as university students would overstate the scope.
31.6% of registered D-2 residents live in Seoul
Regional registered-foreigner data show that 74,404 of 235,767 registered D-2 residents were in Seoul, a share of 31.6%. Gyeonggi followed with 38,060, Busan with 18,518, North Gyeongsang with 17,421 and South Chungcheong with 11,298. The five leading provinces and metropolitan cities accounted for 67.7% of registered D-2 residents.
Seoul and Gyeonggi remain dominant, but Busan, North Gyeongsang and South Chungcheong, all home to regional universities, also have sizable populations. Universities designing international-student support should examine actual residence regions and nationality mixes rather than relying only on the nationwide total. Separately from these statistics, each university can review its own students' nationality and language data when planning admissions information, immigration administration, housing and academic or daily-life counseling.
Data and method
Nationality figures compare the D-2 and D-4 columns in the original foreign-resident tables attached to the Ministry of Justice's June 2026 Monthly Statistics and June 2025 Monthly Statistics. Regional rankings use the D-2 column in the June 2026 regional statistics on registered foreign residents. Because the regional table covers registered foreign residents only, its D-2 total has a different scope from the nationwide status-of-stay table.
Related Articles
- Visa
- Visa
- Visa
- Visa
- Visa
- Visa
Comments
Please sign in to post a comment.
You will return to this article after sign-in.
Sign inNo comments yet.